
|
|
Multipotentialmike |
 About and contact
|
Image credit: Wikimedia Commons
There are several key sources of bias in statistics; it is an imprecise science, after all. In the words of former British Prime Minister Benjamin Disraeli: "There are three kinds of lies: lies, damned lies, and statistics". It is therefore important to realise how such distortions arise, to keep your wits about you, and to be able to fairly appraise statements and policy suggestions. I won't be able to discuss all criticisms here, but I'll elaborate on a few.
The first is sampling bias. This is to say that if we unfairly select a small portion of data from a much larger 'population', there is the capacity to grossly distort the conclusions that might be drawn therefrom. A notable example of this is the 1936 Literary Digest poll. To assess whether Alfred Landon or Franklin D. Roosevelt would win the election, the statisticians employed telephone interviews. They predicted a Landon landslide (no pun intended). The outcome was instead a Franklin D. Roosevelt landslide. Telephone technology, being relatively new at the time, was therefore excessively skewed towards those rich enough to afford it, and it excluded poorer voters. Therefore, it did not cover all of the American electorate.
The affair transpired to be so damaging to the magazine's reputation that it ceased publishing within months of its prediction. However, statistical bias remains (and will always remain). In the annus horribilis of Anglosphere politics, 2016, pollsters missed both the American Presidential election result and that of the United Kingdom Referendum on EU Membership. Few lists of eligible surveyees are comprehensive enough to cover the entire population, and you may not reach them effectively. The Electoral Roll comes close, but still omits a small sliver who are too lazy to register (students, etc.), temporary visitors (what is the steady state proportion of tourists in a given country?), those who have recently moved to the new territory (or have recently crossed an arbitrary threshold time of residency to become enfranchised). The use of the Internet excludes many in some developing countries. The penetration of individual social networks is never absolute among internet users, and platforms vary by country. You might imagine you could stand with a clipboard in a busy shopping mall or on a busy urban street, but then you introduce a socioeconomic constraint, you miss predominantly rural citizens, you miss heavily pregnant expectant mothers who might reasonably spend less time outdoors during that period of their lives.
These are not particularly malicious manipulations. Now instead imagine you are performing a linear regression - a type of analysis designed to look for correlation - on these data:
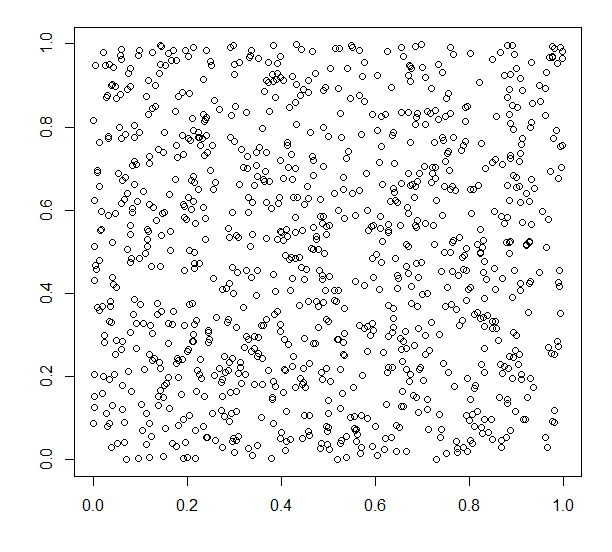
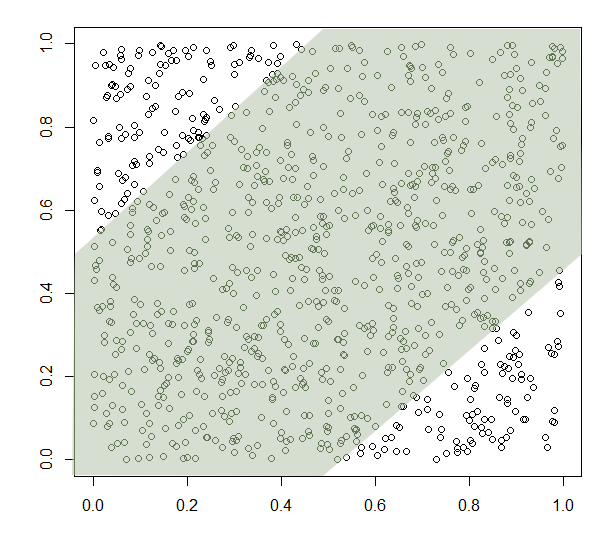
Each point consists of an x- and y-coordinate chosen at random and independently from two uniform distributions from 0 to 1. This means that the points should be spread evenly over the graph and that there should be no link between the two variables. There are 1,000 points. The R2 is 0.05% and the p-value is 0.4938 (these terms will be explained in another article). Essentially, there is no link. Now, let's imagine we apply two filters over the data, like this:
|
|
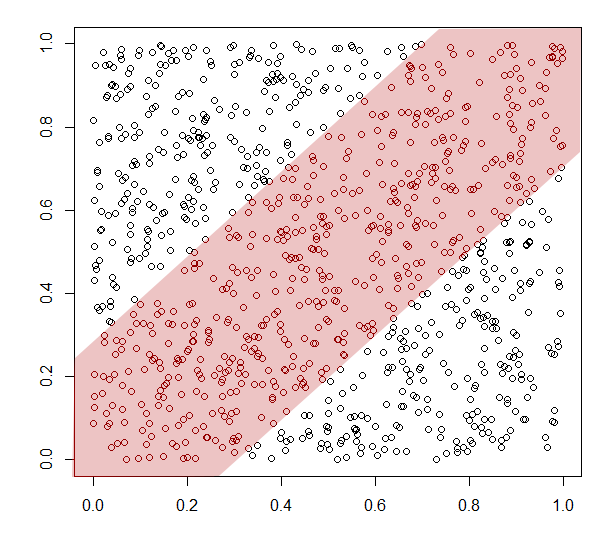
In the case of the green filters, we're not being too restrictive. If we can find a reason to exclude the data points outwith the central region, we then get a link, with R2 equal to 26.32% and the p-value equal to 2.2 x 10⁻¹⁶. This is the lowest possible number that the statistics program R/CRAN can show (the limit of machine representation). In the red case, the link is stronger yet: R2 equals 76.37%. Statisticians would never consider such an exclusion legitimate. But, now consider you can find some reason intrinsic to the nature of your study to convince yourself, or your readers, that some, but not all, of the unwanted data can be excluded. This artificial conditioning may exclude some of your desired data also, but if it affects the unwanted data moreso, then you can spuriously generate a correlation. That is a serious problem.
It is ultimately down to you, the reader, to assess whether or not the data adequately covers the spectrum of what you consider to be sensible or credible. Now consider these two works:
|
|
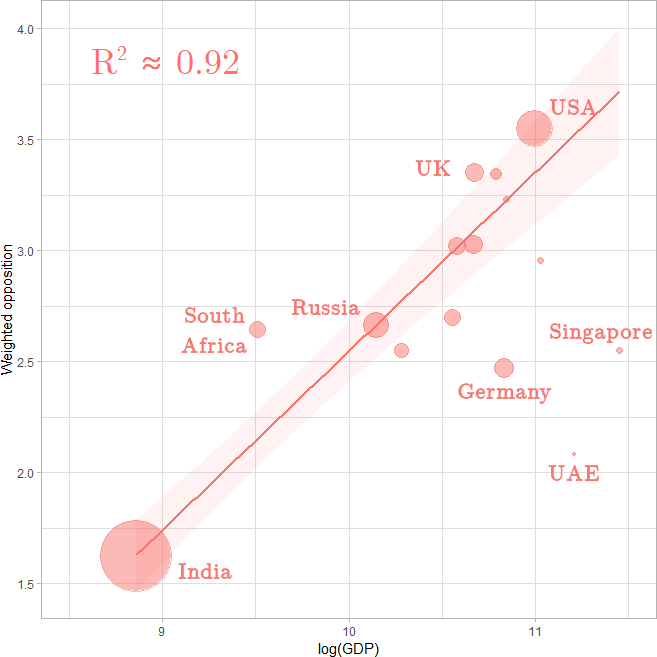
On the left is a correlation between a country's income and its support for a global parliament. The coefficient of variation, 92%, is extremely high, but only 15 countries are represented. There is no precise number as to how many countries in the world there are. Different sources recognise the nationhood of different disputed territories, but the most common consensus, and I believe the one that British television show Pointless' presenter Richard Osman uses, is United Nations membership. That would give 193 countries. Other sources vary from 180 to about 250. But always 15 is a very small percentage of them. There is plenty of scope, therefore, for misrepresentation in those data. More information could easily break the correlation. The argument stands to reason: that poorer countries stand to gain from financial transfers that would likely ensue from global parliament and rich countries do not. But, ultimately, this work is indicative. It suggests there may be a link, but commands further research to strengthen the evidence.
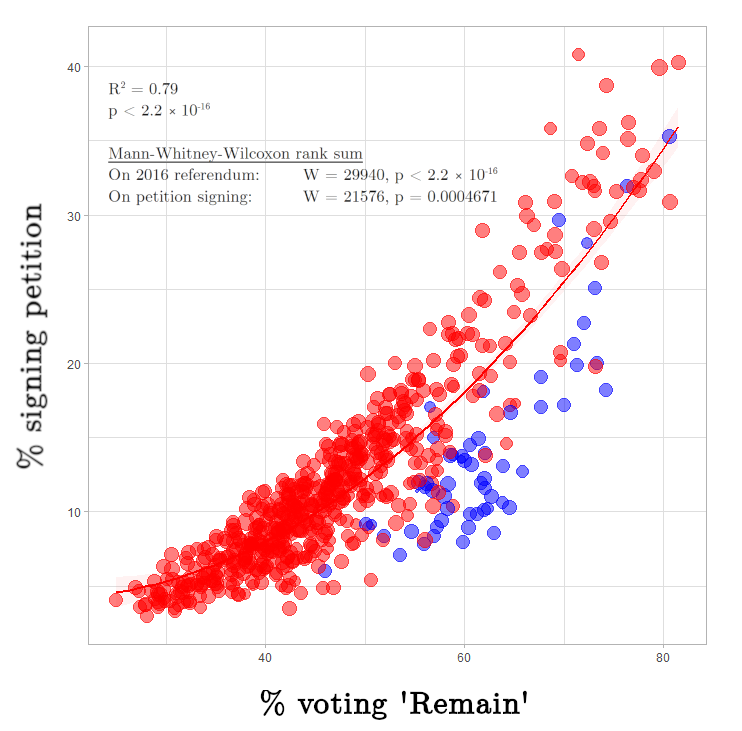
On the other hand, the work on the right, while it is a quadratic regression and not a linear one, is much more convincing. It plots UK constituency data from national statistics releases with UK government data on a petition. At most, probably only about 5% of constituencies might have been missed for some reason. If they were included, even in the most extremely awkward positions, it would not break the correlation.
A similar version of this kind of exclusionary bias occurs in the news media. The renowned American linguist Noam Chomsky elaborated in his propaganda model four filters that apply:
- Ownership
- Advertising
- Sourcing
- Flak
In a statistics sense, the sourcing is important. I only report on data that I have analysed and from which I have found positive results. Even then, I would only publish data which are commensurate with the stated ideological aim of my work: radical human unity. For a long time, financial and sourcing biases such as these also plagued scientific publishing, in respected journals with high impact factors, like Nature. Because they selectively published work that actually found something, they biased meta-analyses which aggregate data across studies to draw broader conclusions. This is something akin to an academic variant of journalistic sensationalism, no different from that peddled by mass-market tabloids, like The Sun.
Study registration is an important remedy for this. The basic idea is that would-be authors extensively detail their methodology before work is done, and the results are published, regardless of whether or not they actually find anything. Uptake is not yet high.
The nature of frequentist statistics also necessitates the so-called 'p-value'. This is the chance that you would get such outlandish data that showing an effect if there weren't really one present, to put it simply. A usual threshold is 0.05. This means that 1 in 20 results are actually fictitious, if such a threshold is applied. Given the sheer volume of data generated in the modern Information Age, this is not insignificant at all. That said, I try not to publish here any work which has a p-value higher than extremely low numbers. Much of my work hits that limit of machine representation, 2.2 x 10⁻¹⁶, but again, it's up to you to decide if it's fair. In some quarters, Bayesian approaches are suggested as an alternative.
The final types of bias I would like to discuss here are not mathematical at all, but rather psychological and sociological. The psychological biases are well elucidated in Daniel Kahneman's book Thinking: Fast and Slow, and include such things as apophenia, or finding patterns in things that are not there: animals in cloud formations, for instance, or spurious numerology (the film The Number 23 covers this well). There is also confirmation bias: our brains are far more receptive to, and more likely to remember, information which confirms our already-extant hypotheses. These are not easy biases to disentangle; in fact, education about them tends to worsen them.
Sociological biases are very pernicious. We have homophily: that's the tendency to associate with people who share similar interests as us. There's the cross-race effect, in which we find it difficult to disambiguate people in other ethnic categorisations than those with whom we spend the most time (though - importantly - not necessarily our own!). There's a similar cross-age effect. Assortative mating ensures the progeny of the top 1% and other income percentiles are more likely to marry and procreate with each other than across the income spectrum. Geographical restriction ensures we only spend time and befriend those physically close to us. Benz' car and the Wright brothers' aeroplane actively and happily work against this. The remedy for these as a whole is simple, but important: befriend, and spend time with, a diversity of peoples across every domain in which humans may outwardly appear to vary: you'll find a chilling high degree of commonality in our basic nature.
So, if I am biased, why am I being honest thereabout? The American mathematician John Allen Paulos has, in his work, spoken about innumeracy, a lack of facility with numerical data akin to, but much more widespread than, illiteracy. Inability to contextualise numbers has led to much human suffering. Exclusionary propagandists have created much pain before, and they are emerging again. I publish here to educate, that you may be the better enabled to resist their incursions.
See also
 |  |